


Network Architecture
We introduce the network architecture of the SmartSense platform. The platform is isolated in a private network. A server interface this private network with the Irisa/Inria network. Users can access data from Irisa/Inria network and the Internet.
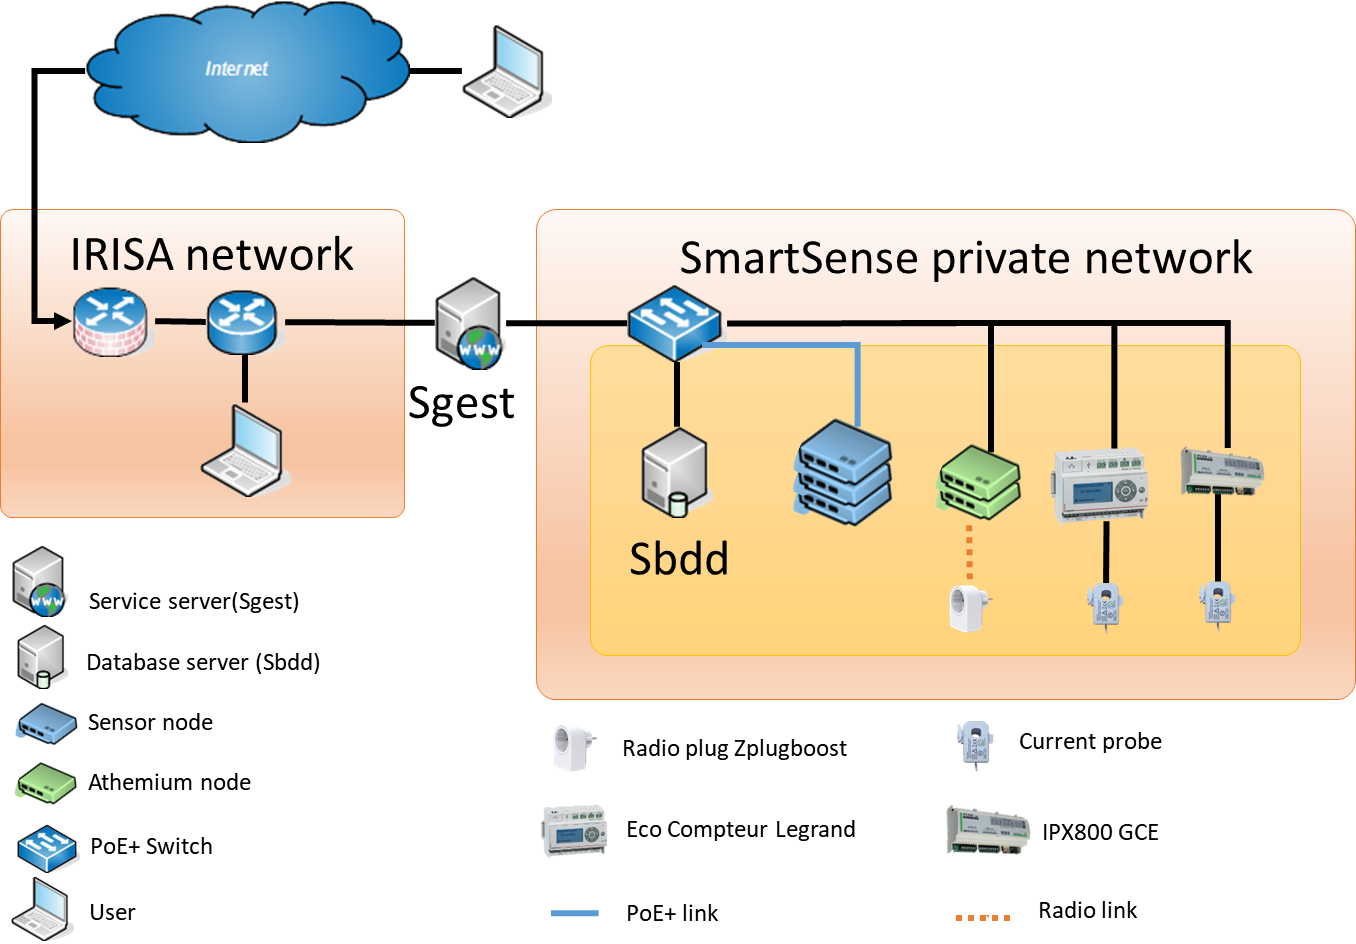
Simplified network architecture of SmartSense platform.
The nodes
The different elements tracing data are:
- Sensors nodes;
- Athemium nodes;
- Electricity meters (EcoCompteur et IPX800);
- Current plugs Cléode Zplugboost.
Sensors node are dedicated to environmental data harvesting. Athemium nodes harvest electricity consumption information.
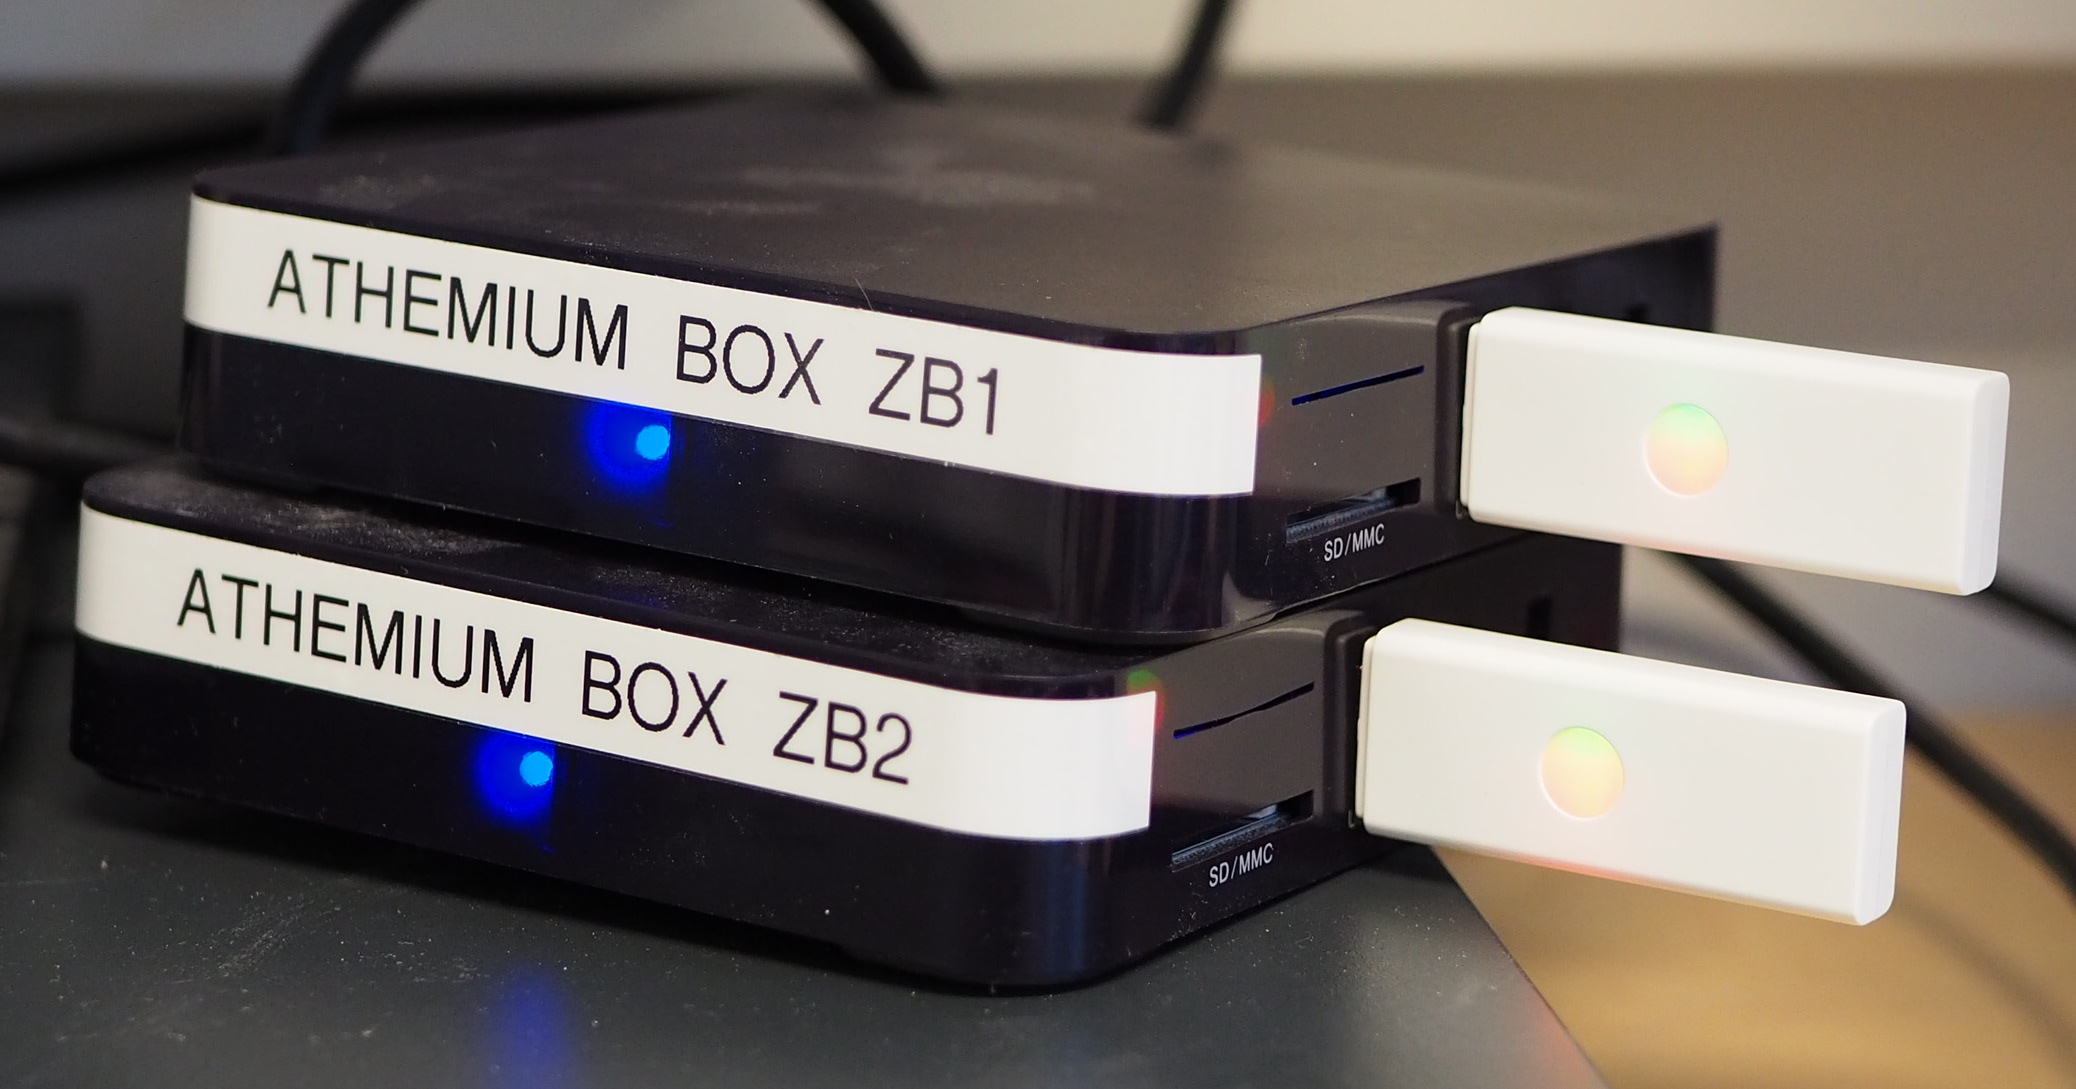
Athemium node and radio receiver Cléode Zplugboost
Element measuring electricity consumption (Smart electricity meters and plug Zplugboost) trace back their data to Athemium node. On the above picture, 2 Athemium nodes with their Cléode plug radio receivers. Each node treats data of 25 plugs.


Sensor node use the same hardware as the Athemium nodes. Software solution develop by Athemium is almost the same on the 2 node types. Difference is the type of data to harvest. Athemium uses plug-in for each different data type. Sensor node use a plug-in for each sensor modules. Athemium node use one plug-in for radio plugs and one far each type of smart electricity meters. Whatever the node, their is a MQTT client which trace back the data to the server.
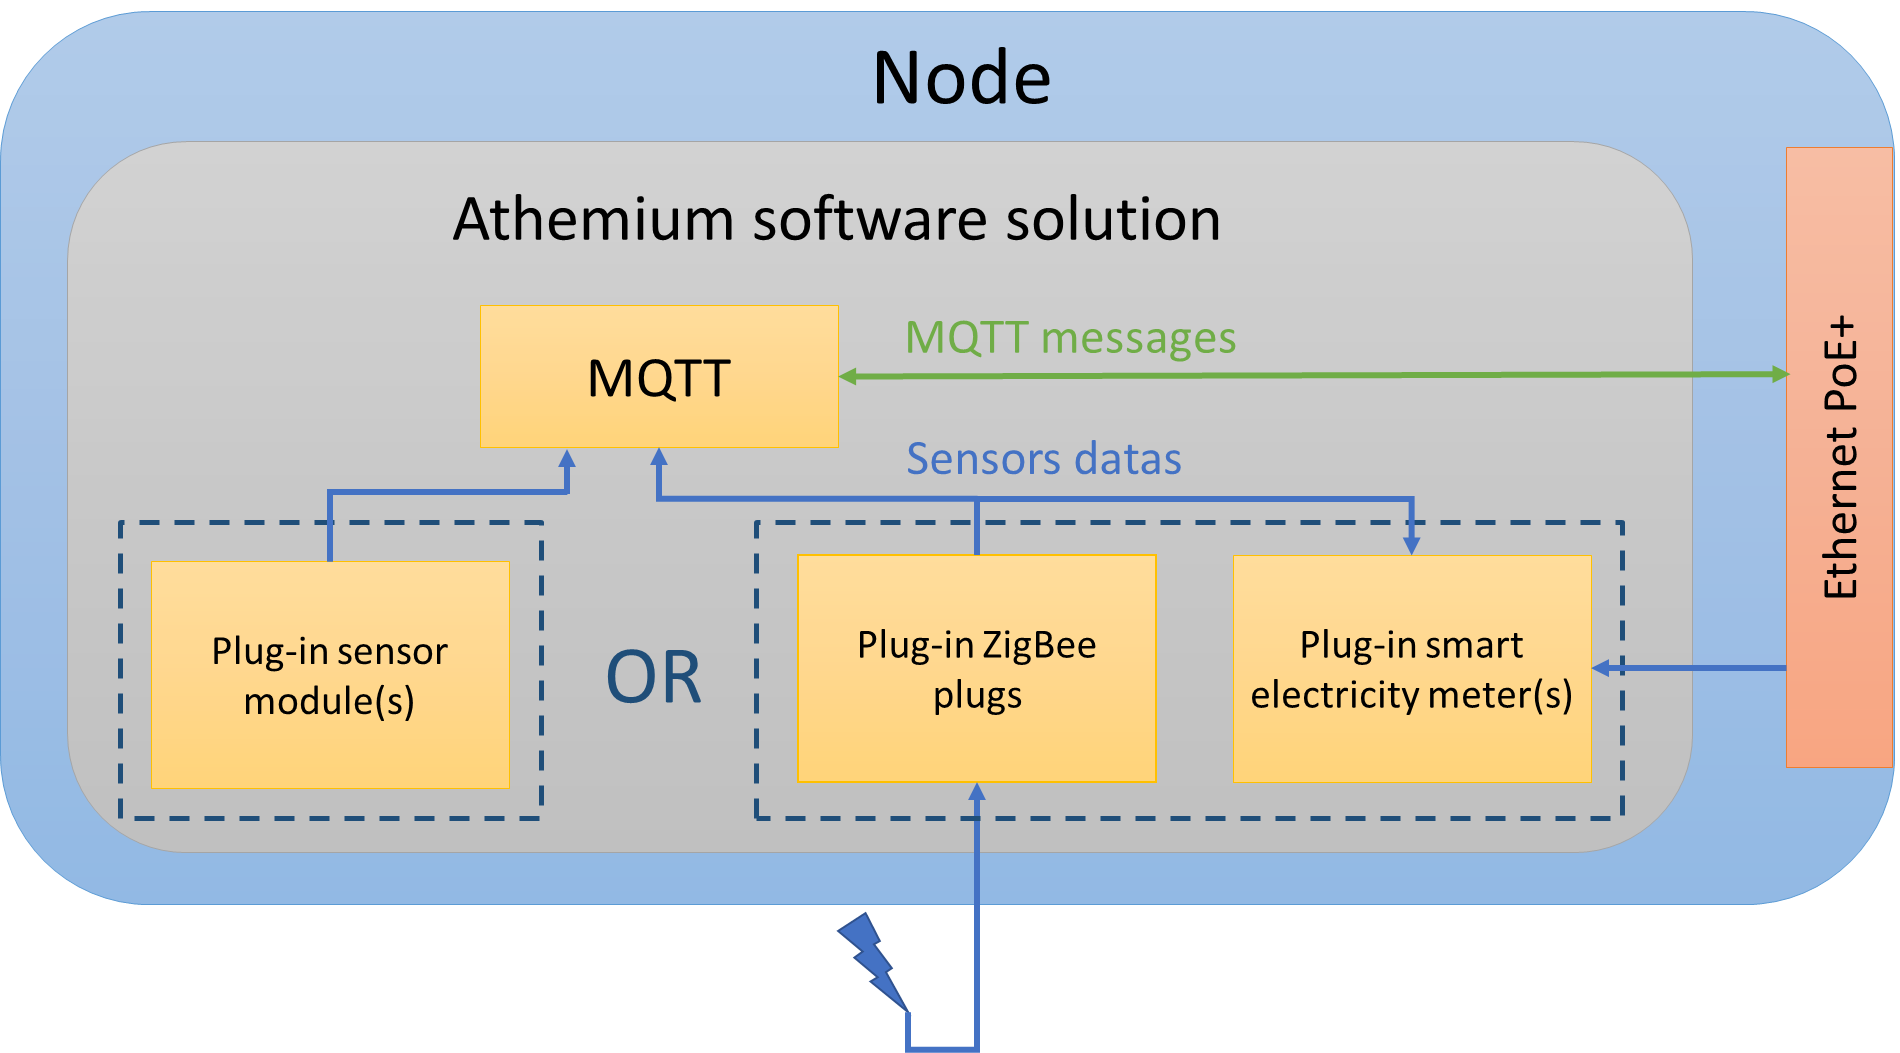
Software nodes solution.
Data from from plugs are received by radio (ZigBee). Data from smart electricity meters are received by Ethernet.
Servers
As we seen on the simplified network schematic, platform have 2 physical servers.
- Service server (Sgest);
- Database server (Sbdd).
To simplified the explanation we have the 2 servers on the same schematic.
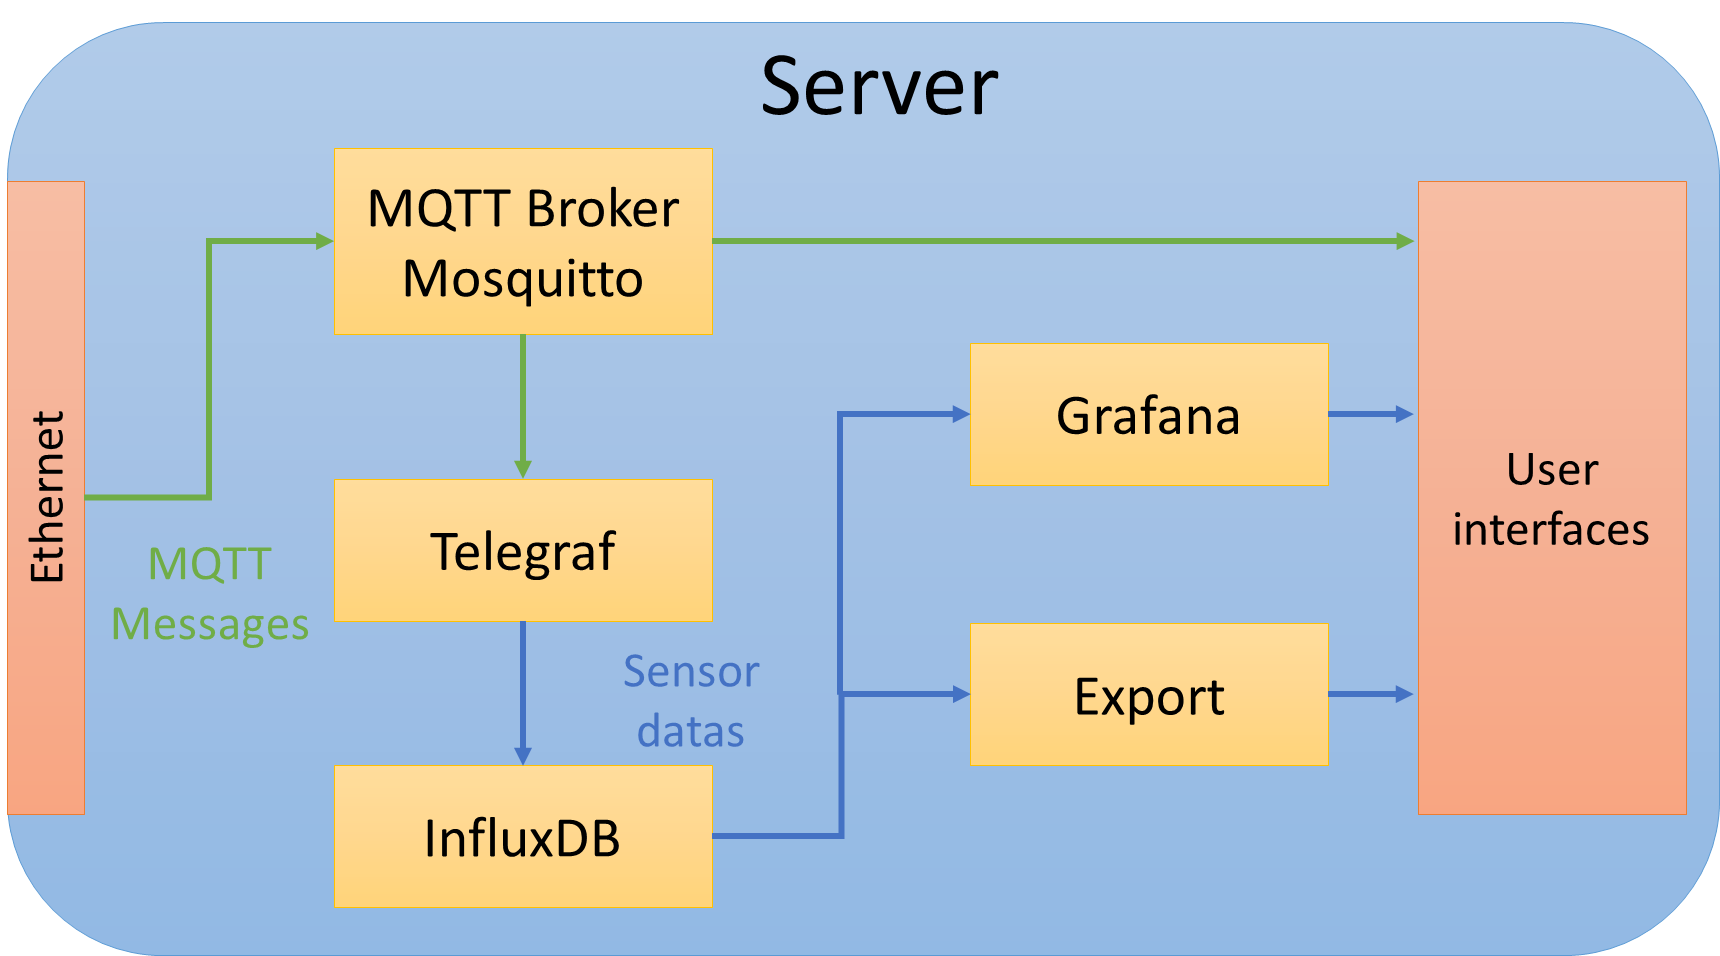
Servers software solution.
When a MQTT message arrive on the sever, it is treated by the mosquitto MQTT brocker. This message is then send to the database (InfluxDB) by the Telegraf plugin. Our datas are time series. InfluxDB is a specialized database for time series. Their is 2 user interfaces. A web interface develop by Athemium and more general interface using a classic MQTT client.
The web interface allows user to:
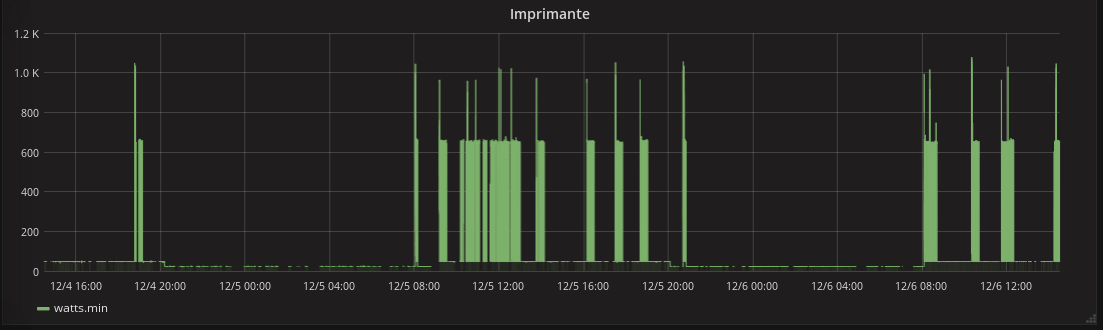
Printer laboratory consumption during 2 days period on Grafana.
Users management
Their is user managements rights. User could have restrictions on:
- Data type (example: temperature data only);
- Data of geographical zone(example: coffee room of the laboratory);
- Data access time(example: unlimited, during 1 month).
MQTT
A MQTT message is constitute of a topic and a payload.
The topic is hierarchical
To subscribe to a a topic, you can use wildcards:
- ‘+’ substitute for one topic level;
- ‘#’ covers an arbitrary number of topic levels (it has to be the last character in the topic).
Examples:
- «event/production/Lannion/+/+/MAC-F0_79_59_16_48_A7/#» subscribe to all the sensors of the device with MAC address F0:79:59:16:48:A7;
- «event/production/Lannion/labo/+/+/+/temperature» subscribe to all temperature sensor of Lannion site.